Market Data Bank
Click image to enlarge
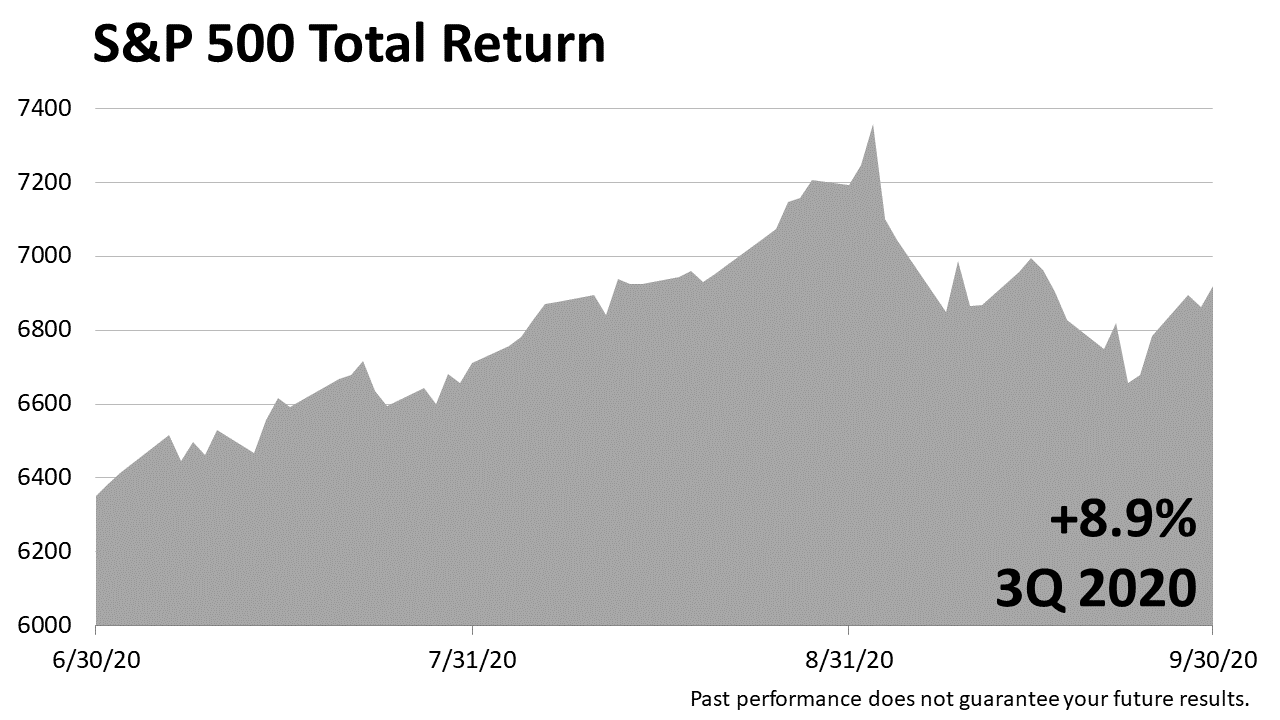
Stocks posted an +8.9% gain in the third quarter of 2020.
It was the second quarter of strong returns following the COVID bear market.

Click image to enlarge
The Standard & Poor's 500 in the third quarter recovered fully from the -33.9% bear-market drubbing suffered in February and March, after the onset of COVID in the U.S., and stocks hit a new record high on September 2, 2020.
While the stock market has come back strongly, the actual recovery from the epidemic did not go nearly as well.

Click image to enlarge
By the end of the third quarter, the number of lives lost to the COVID-19 virus in the United States topped 200,000.
By now, we almost all have a friend or family member who has been stricken by the virus, and the suffering and loss across the nation is incomprehensible.
While the balance of this report will focus on the return to normalcy in the financial world, so many Americans are waking up every day to a world of hurt and grief that is nothing like normal!
Acknowledging the loss of so many Americans is the right place to start, and we extend our heartfelt condolences to those who have lost a family member or friend.

Click image to enlarge
Okay, let's start from the perspective that financial economic trends unfold slowly.
They're like watching paint dry, and a single quarter of data is just a snapshot at a moment in time.
Click image to enlarge
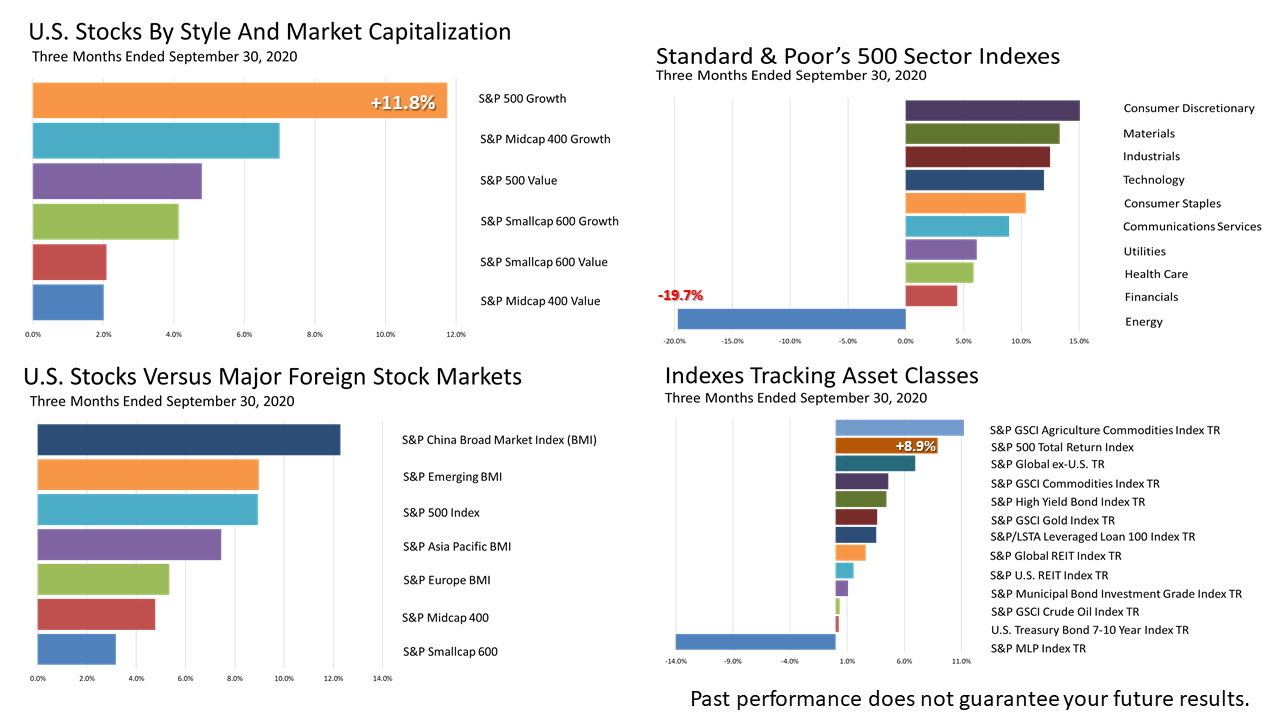
With that caveat, the big financial news in the three months from July 1 to September 30 was the outstanding +11.8% return on U.S. large-cap growth stocks.
The S&P 500 for decades has returned about +10% annually, and the +11.8% was way above normal, especially when you consider the very strong second-quarter return of +20.5%.
The other takeaways from the three-month performance of financial indexes were the -19.7% plunge in energy stocks and the excellent performance of U.S. stocks versus a broad range of 13 asset classes.
The outperformance of U.S. stocks versus a broad array of other indexes has been a recurring pattern in modern history.
We have carefully documented the strong performance of U.S. stocks relative to other assets for many years in these quarterly reports.
Now, It is important to remember that stocks are just one investment in a strategic portfolio designed for a typical retirement investor.
To be clear, a lot of investors think the S&P 500 return is what they should earn, but that is totally unrealistic.
The S&P 500 is quoted every day and is a benchmark of blue-chip stocks, the largest public companies in the U.S.! But the S&P 500 is NOT a good barometer of what a prudently invested portfolio is likely to earn.
By "prudent," I mean portfolio design based on modern portfolio theory.

Click image to enlarge
Modern portfolio theory is a large body of financial knowledge based on academic research done over the last 70 years.
This approach does not guarantee success -- nothing can. It's called a theory because your investment results can't be guaranteed.
However, it is assuring to know that this framework for investing is now taught in the world's best business schools and embraced by institutional investors.

Click image to enlarge
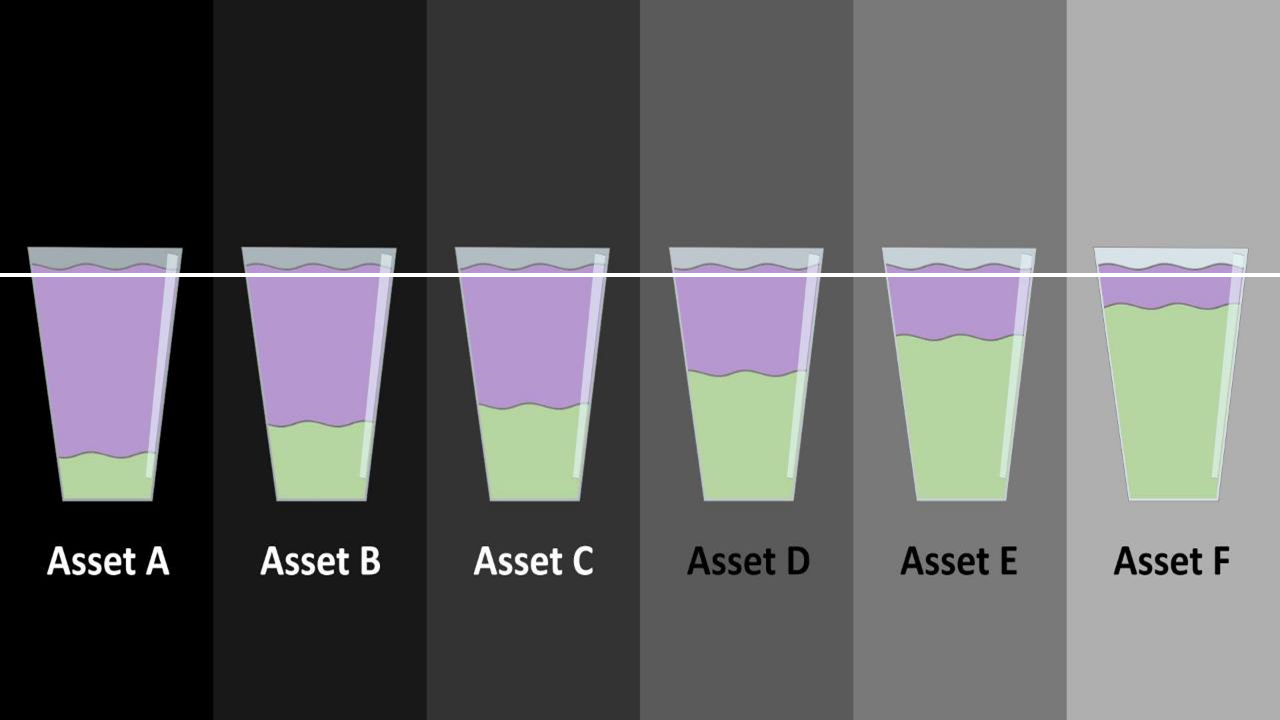
Modern portfolio theory (MPT) is a framework for managing investment risk based on financial, economic, and statistical facts.
Classifying investments based on distinct statistical characteristics imposes a quantitative discipline for managing assets based on history and fundamental facts about the economy.
Click image to enlarge
While MPT is a good quantitative basis for evaluating investment risk, the world is too dynamic and not enough statistical history exists to make predictions with any certainty about which investments will outperform in the months ahead.
Human judgment and an understanding of historical performance is critical in applying modern portfolio theory.
Applying modern portfolio theory also requires periodically lightening up proportionately on the most-appreciated types of assets and buying more of the types of assets that lagged. The exact amount of each asset is set based on personal preferences, age, and specific circumstances.
Click image to enlarge
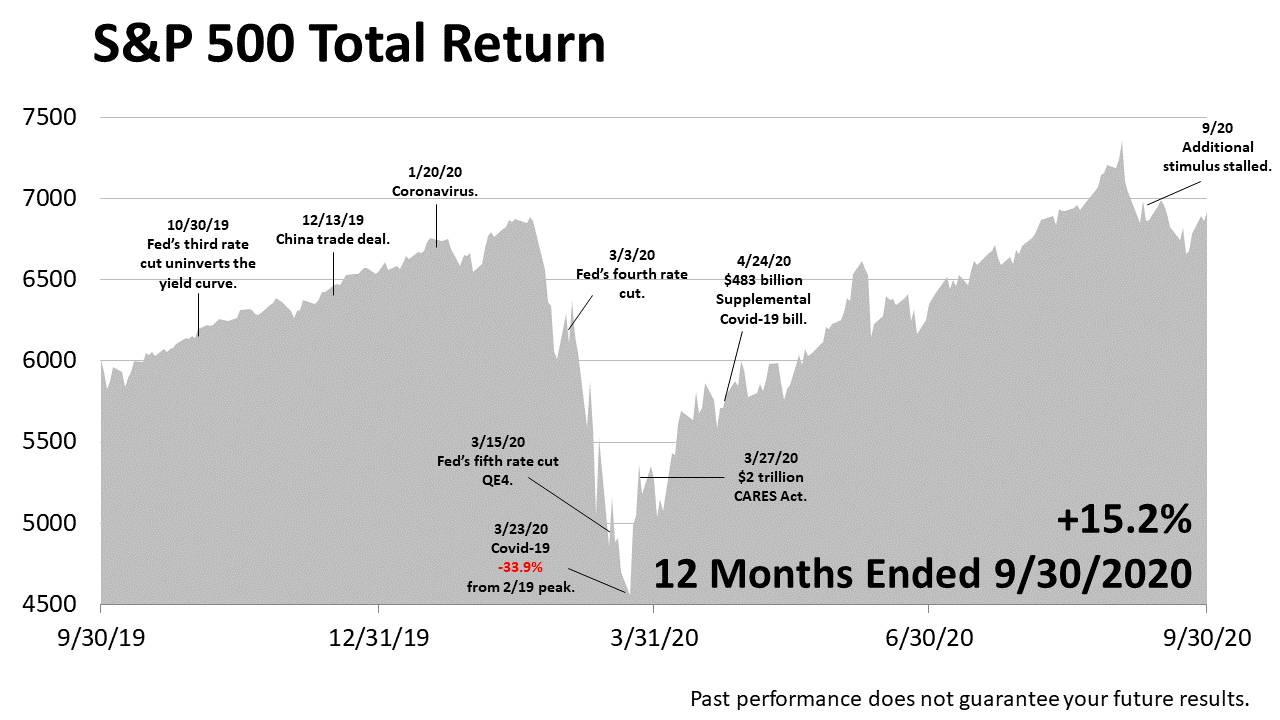
By the end of the third quarter of 2020, not only had stocks recovered fully from the COVID bear market drop of -33.9%, but the S&P 500 index topped its previous all-time high.
Click image to enlarge
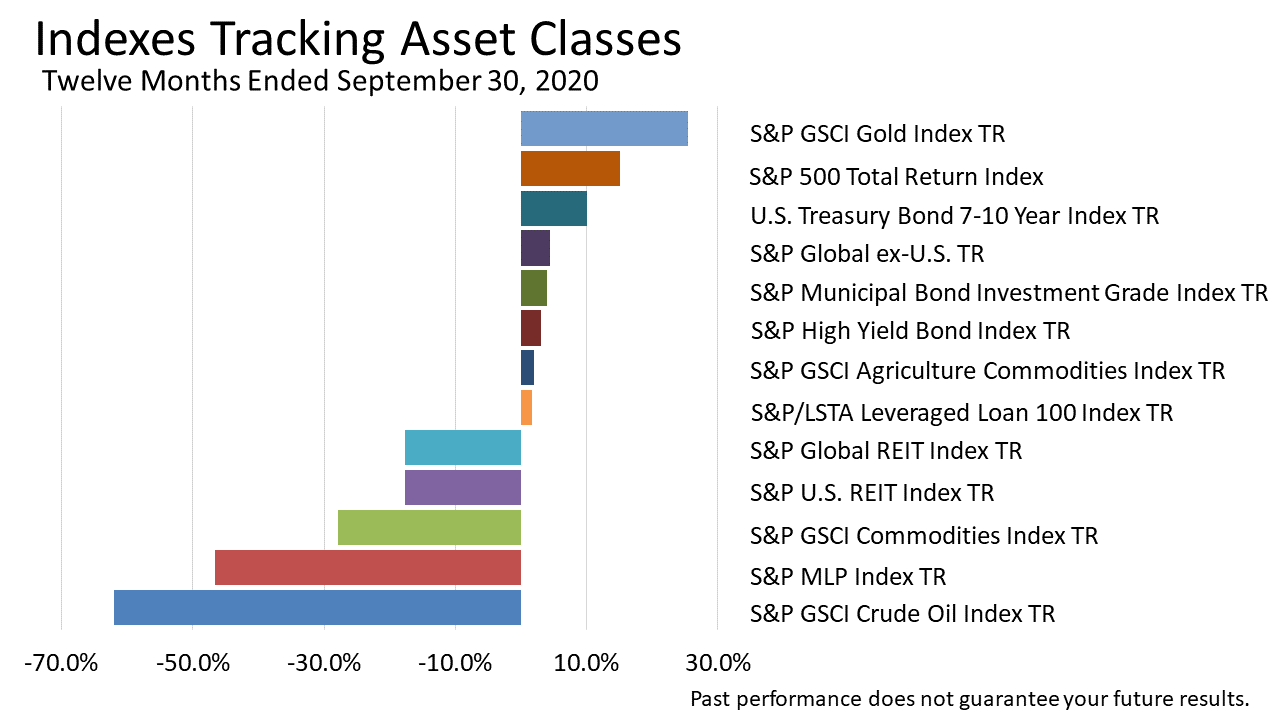
Looking at stock returns compared with a broad range of other types of investments in securities over the 12 months ended September 2020 shows just how well U.S. stocks performed versus bonds, foreign-country stocks and bonds, and a broad range of other assets.
In plunging by -33.9% from their previous peak to a COVID bear market low on March 23, 2020, stocks behaved like a "risk asset," just as they're expected to do. By dropping precipitously and exhibiting risk, stocks earn their reputation for rewarding those who can hold on through the scariest times – the equity risk premium.
Click image to enlarge
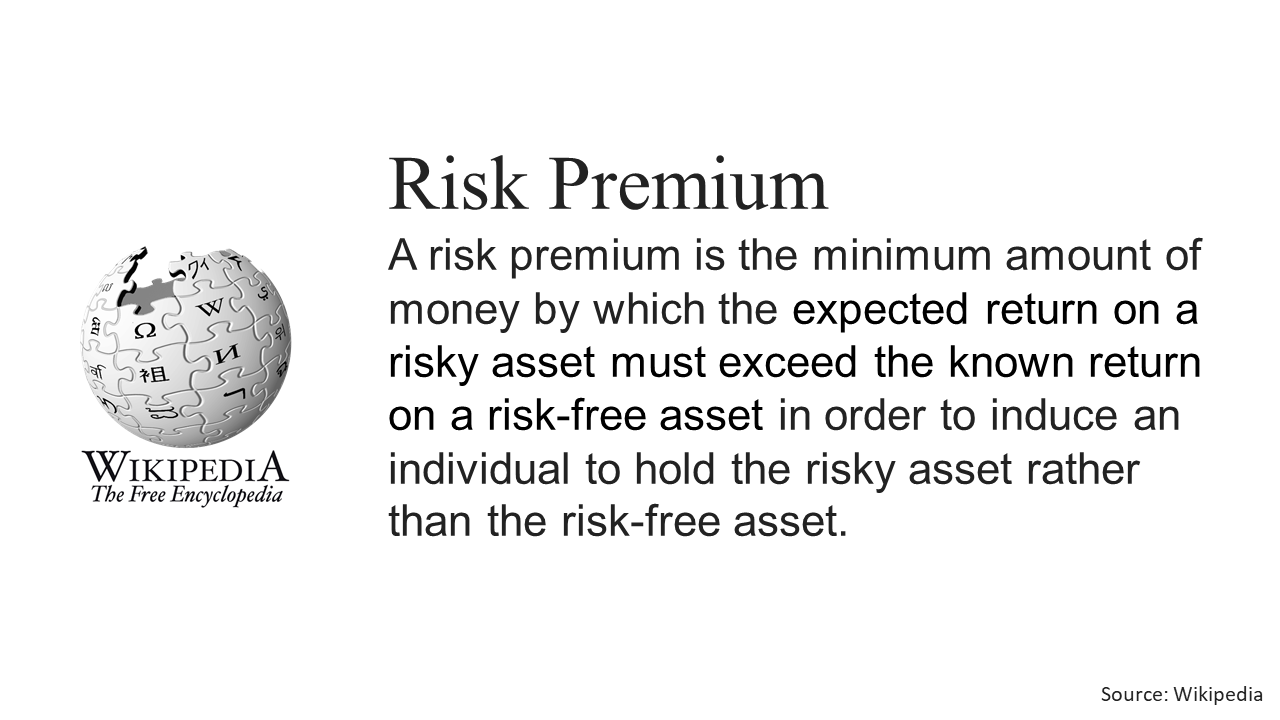
A rubric of modern portfolio theory holds that investors get paid extra return for taking risk.
The risk premium is the amount you get paid for owning a risky asset.
Click image to enlarge
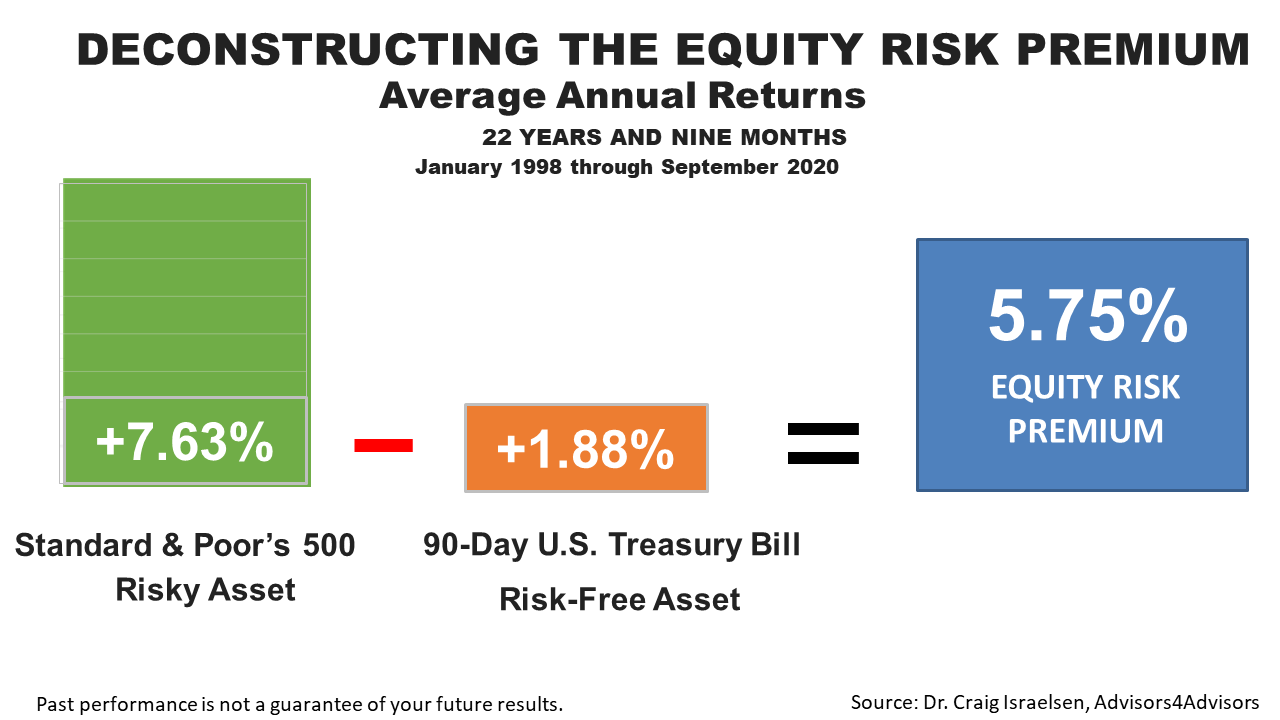
To quantify the equity risk premium, here are the numbers: Over the 22 years and nine months ended on September 30, 2020, the risk-free 90-day U.S. Treasury bill averaged an annual return of +1.88%, compared to a +7.63% annualized return on the S&P 500 stock index.
By subtracting the 1.88% from the 7.63%, we quantify the premium stock investors have been paid as +5.75% annually over the boom and bust cycles since 1998.
Owning stocks through the tech bubble in 2000, financial crisis in 2008 and 2009, and the COVID bear market rewarded investors with a premium of 575 basis points over what they would have earned by investing in risk-free 90-day Treasury bills.
Click image to enlarge
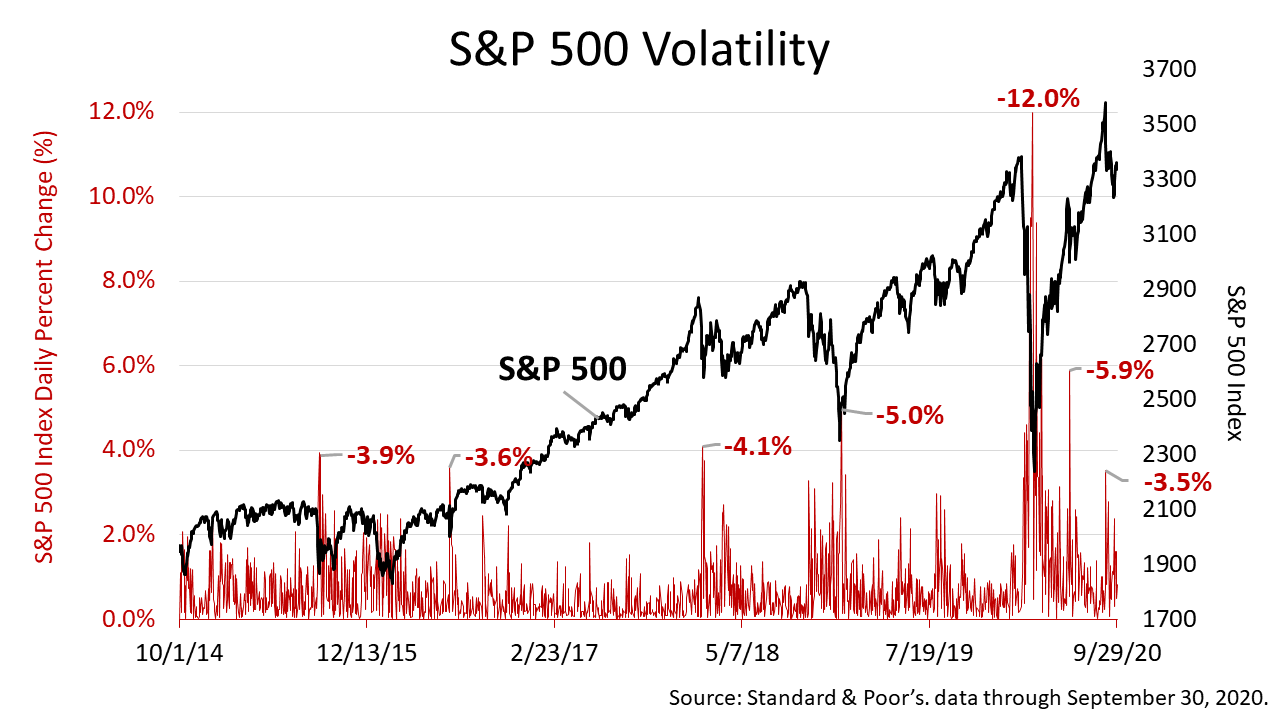
This chart does a better job of illustrating the scary part of the equity risk premium.
The red data series shows the daily changes in the stock market, as represented by the S&P 500.
Big one-day drops of between -3% and -5% are not uncommon, and earlier this year we had a single-day plunge of -12%!
So, indeed, earning the equity risk premium is hard and scary at times.
But again, if we're just armed with these kinds of statistics, which show that big daily down days do come frequently and almost like clockwork, it is easier to withstand the uncertain times.
With the COVID outbreak continuing and the worsening hospitalization rate across many states, the risk of a stock market plunge should be expected, but retirement investors – permanent investors who plan to own stocks for the rest of their lives – would be wise to view volatility as a friend.
That's a different way of looking at the world, but it absolutely is valid.
Choosing to expose a portion of your portfolio to price volatility, also known as risk, enables you to earn a better return over the long run.
You wouldn't earn the 6-percentage-point equity risk premium in stocks if you weren't exposed to lots of volatility.
It just goes with the territory. It's part of owning a risk asset.

Click image to enlarge
Times of painful stock market losses are when investors actually earn the equity risk premium, and that's an important financial fundamental to remember in times like these.

Click image to enlarge
Technology stocks led the way again over the past 12 months, while the price of energy securities plunged.
The domination of technology stocks is important.
Let's review how the stock market has been dominated by the FAANGM – Facebook, Amazon, Apple, Netflix, Google, Microsoft.

Click image to enlarge
Facebook, Amazon, Apple, Netflix, Google, and Microsoft – the FAANGM – have led the recovery in stocks since the pandemic low on March 23rd, 2020.
The FAANGM left the broad market in the dust.
And because the major indexes are weighted by market capitalization, the super returns on just these tech giants powered a gain of more than +40% in the S&P 500 from the March 23rd, 2020 bear-market low to September 30th.
FAANGM turbocharged returns of the Dow Jones Industrials as well as the S&P 500, creating a COVID crisis anomaly.
However, FAANGM valuations are not out of control.
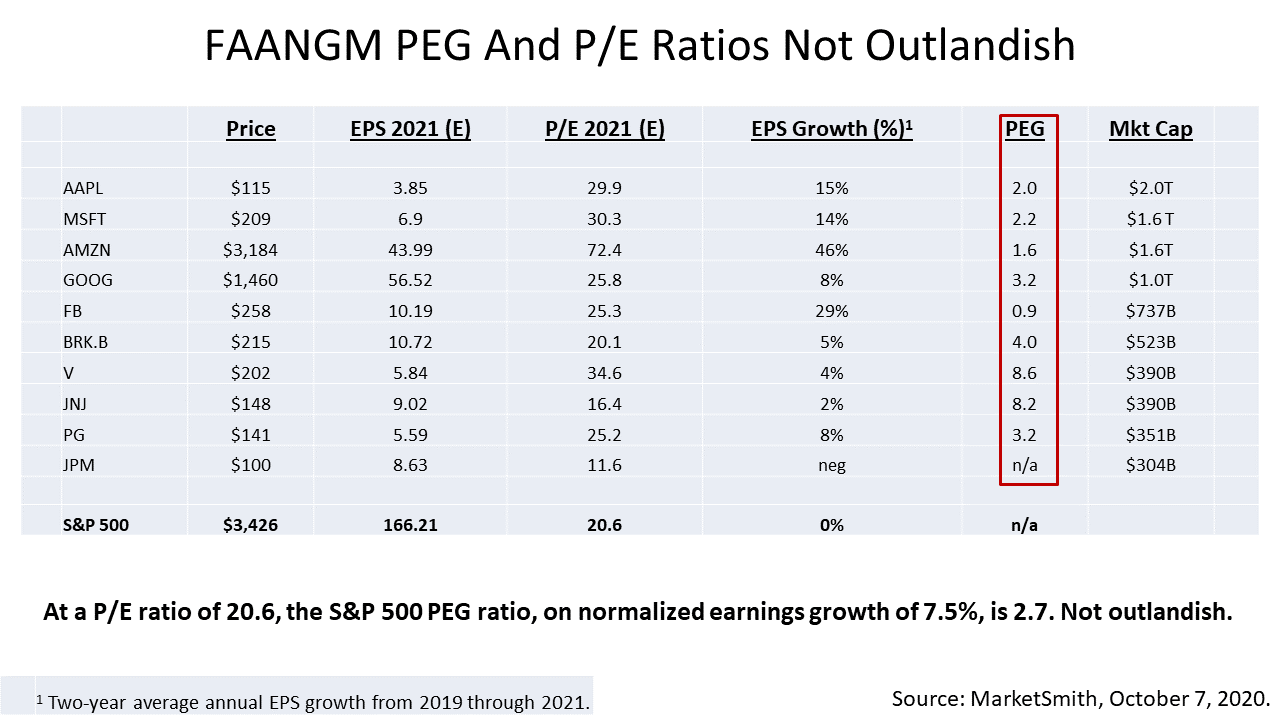
Click image to enlarge
The PEG ratios of the FAANGM – that is, their price-to-earnings ratios divided by the growth rate of their earnings, a more thorough metric than a standard P/E ratio – were not outlandish, not even after the price of the S&P 500 broke a new record high on September 2nd.
Click image to enlarge
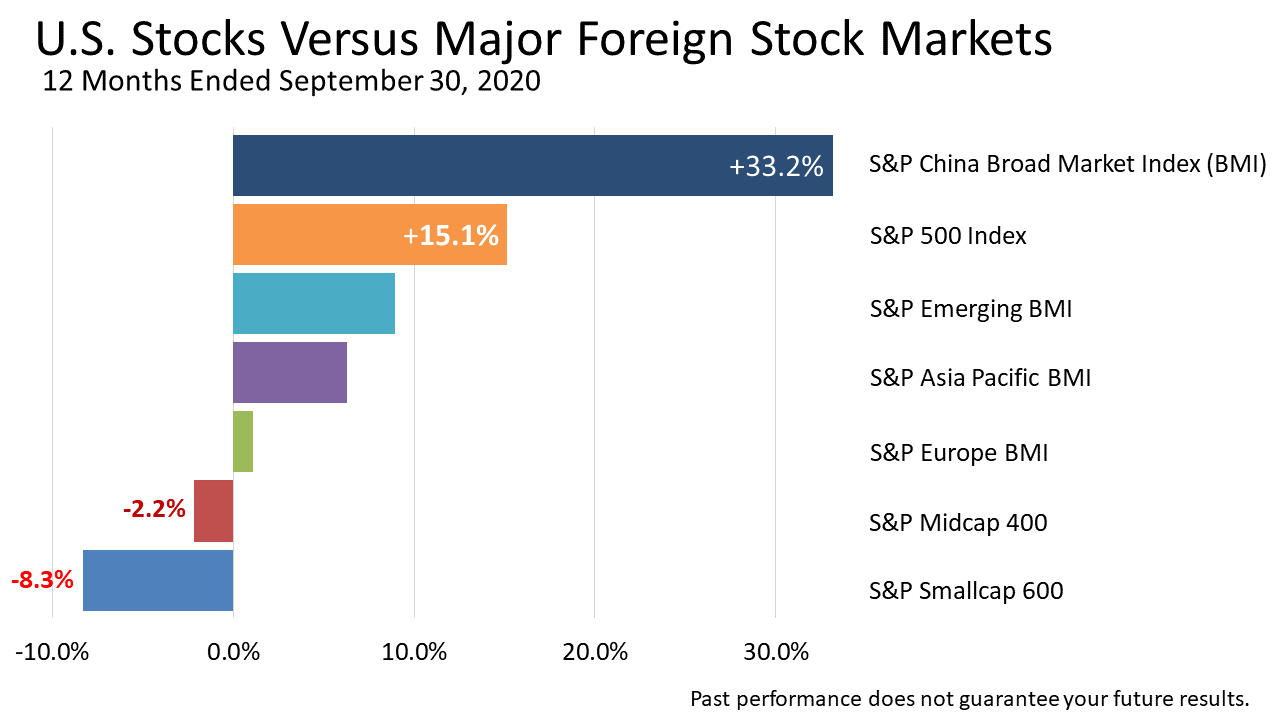
The 12-month return on the S&P 500 through the end of September was +15.1%, versus a +33.2% return on the China Broad Market index of stocks.
Equating the Chinese stock market index 12-month return of +33.2% with the +15.1% return on U.S. stocks is one of the mental mistakes investors often make.
It's the kind of thing that makes investing hard.
Looking at this chart, it's easy to make a case for investing in Chinese stocks.
But that would totally ignore the fact that the Chinese accounting system is not the same as in the U.S.
One of the benefits of working with a fiduciary is that you should be able to avoid mistakes like that or getting sold on a bad idea.
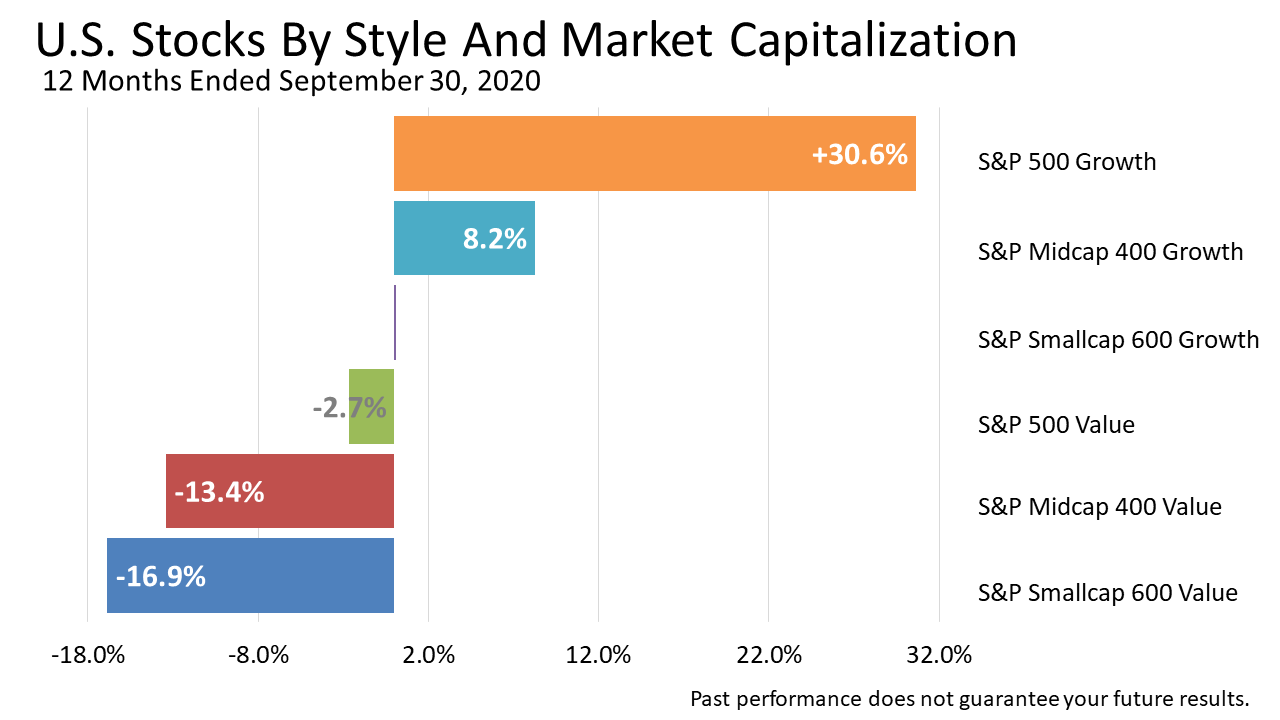
Click image to enlarge
This snapshot of the 12-month return on the S&P 500 through the end of September shows the FAANGM's powerful effects.
The uneven returns of the 500 stocks show up here.
Value stocks, especially smaller ones, suffered double digit losses, reflecting the pain of the pandemic and its financial damage to many of the 494 other companies outside of the FAANGM.
Click image to enlarge
The FAANGM dominance is one of many anomalies in the post-COVID era of late 2020.
Click image to enlarge
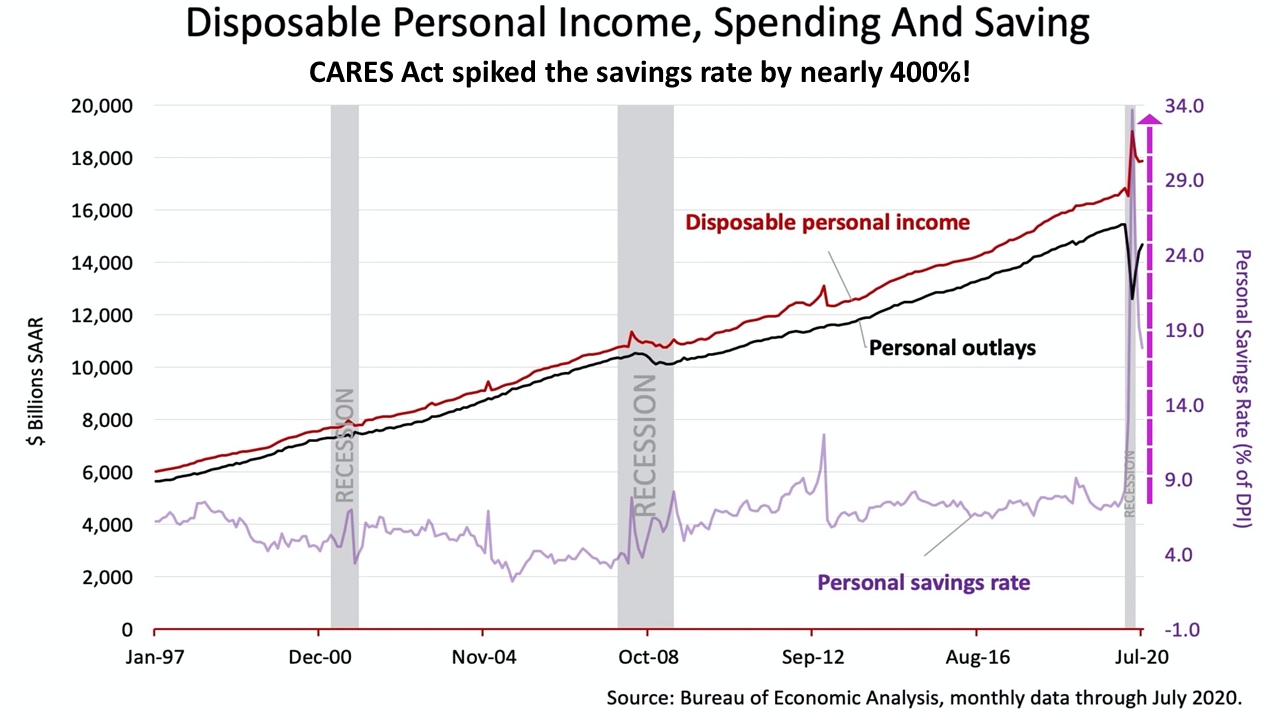
The savings rate shot up by nearly 400% after the CARES payments hit.
CARES, of course, is the acronym for the Coronavirus Aid, Relief, and Economic Security Act, the $2.2 trillion – with a T – aid program that liquefied the economy and probably prevented the COVID Recession from becoming the COVID Depression.
While the savings rate came down as the quarter unfolded, a new stimulus was stalled.
Click image to enlarge
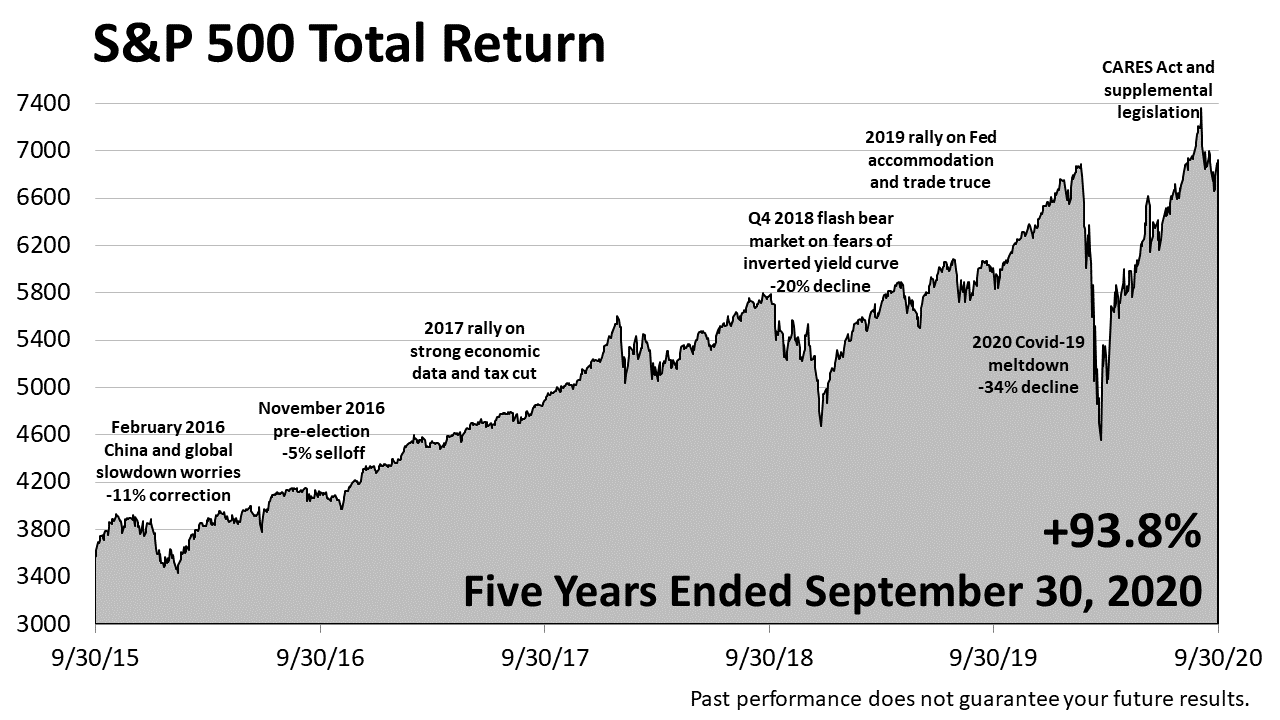
Over the five years ended September 30, 2020, including dividends, the S&P 500 Total Return index gained an astonishing +93.8%.
The five-year gain equates to compound annual growth rate of +18.8%!
That's nearly double the stock market's long-term annual total returns of approximately +10% going back 200 years, as described by Wharton Business School's professor Jeremy Siegel in his seminal book, Stocks for the Long Run, first published in 1994.
Despite the COVID pandemic bear market plunge in February and March 2020, investment in stocks nearly doubled in this five-year period, which was fraught with uncertainty.
Click image to enlarge
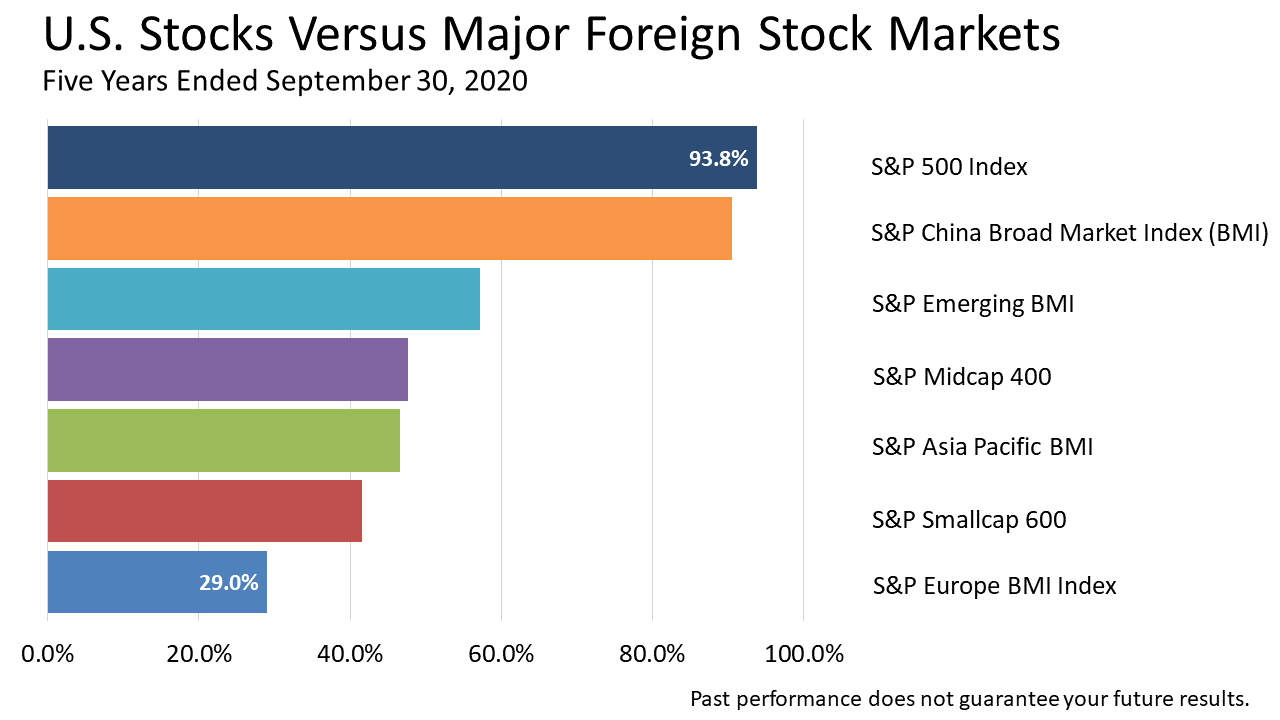
In the five years ended September 30, the Standard & Poor's 500, an index of the largest publicly traded companies, delivered more than three times the total return of the European stocks, and double the return of the S&P Broad Market Index for Asia Pacific stock markets.
Click image to enlarge
This bar chart highlights just how extraordinarily the S&P 500 index performed in the five years ended September 30, 2020.
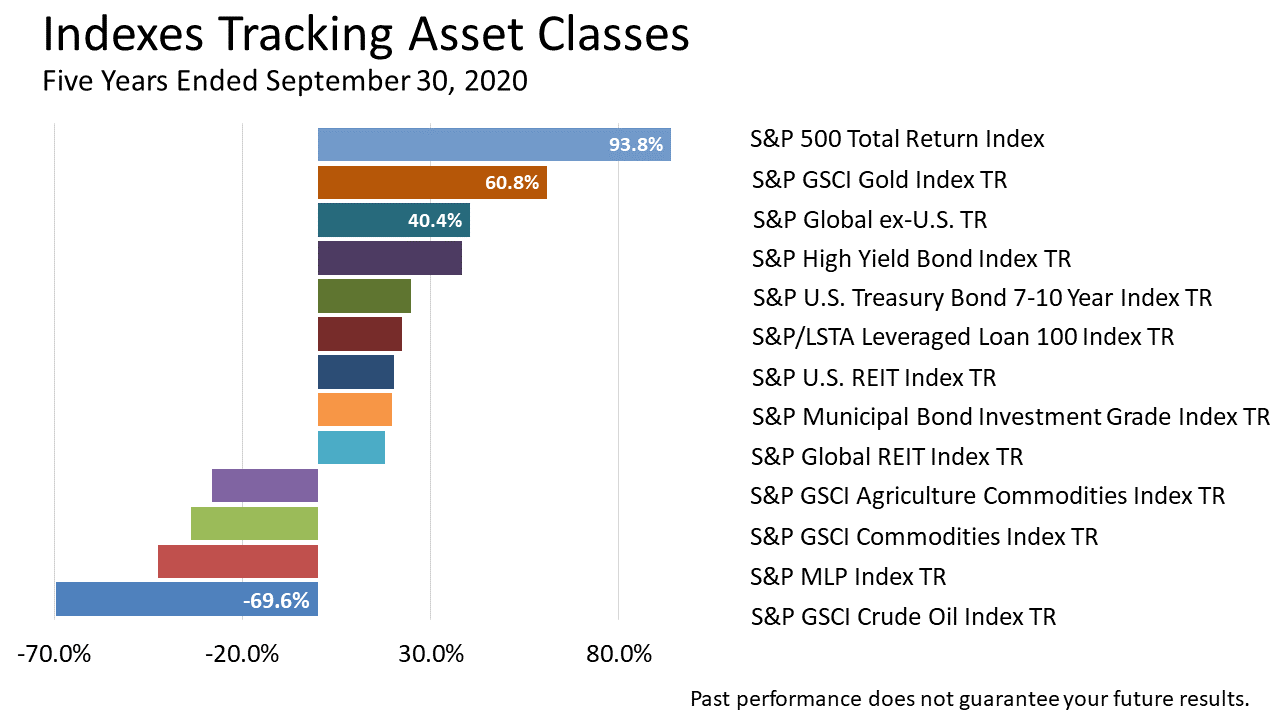
U.S. stocks were No. 1 among the 13 investments shown, which includes a diverse group of assets with different characteristics.
Notice how the S&P Global stock index that excludes U.S. stocks returned +40.4%, less than half the U.S. stock market, as measured by the S&P 500.
The other noteworthy performance in this broad group of indexes was the +60.8% return on the S&P Gold stock index.
Gold has been a lagging performer for years.
However, with stocks fully valued and bond yields as low as they've been in years, gold has become a relatively more attractive asset class.
The rising price of gold is a trend to watch in the months ahead.

Click image to enlarge
Growth stocks – propelled by the FAANGM – returned almost three times as much as value stocks in this five-year period.
This, again, is part of the COVID anomaly that favored the six tech giants during the pandemic.
As mentioned earlier, the FAANGM, despite their run-up and great influence over the S&P 500, are not wildly overpriced, and their valuations are nothing like the tech stock bubble 20 years.

Click image to enlarge
On the right, growth stocks – propelled by the FAANGM – returned almost three times as much as value stocks in this five-year period.
On the left, tech stocks, over the same five-year period, delivered a phenomenal +233% total return!
This, again, is part of the COVID anomaly that favored the six tech giants during the pandemic.
As mentioned earlier, the FAANGM, despite their run-up and great influence over the S&P 500, are not wildly overpriced, and their valuations are nothing like the tech stock bubble 20 years.

Click image to enlarge
In looking at these performance numbers and the near-doubling of investment in stocks in the past five years, it's important to remember that the S&P 500 is just one component of a broad portfolio.
U.S. stocks are the key "growth" component in a diversified portfolio designed to match your risk tolerance, your "risk personality."
As the risk asset in your portfolio, stocks are expected to outperform other less risky holdings, as we illustrated earlier in discussing the equity risk premium.

Click image to enlarge
But it is so very important to remember that to get the returns on the S&P 500, your portfolio would have to be 100% invested in stocks, and most investors simply could not stomach the volatility of a 100% stock portfolio.
Seeing your life savings decimated by brutal bear market losses like the one we experienced in February and March 2020 after the COVID outbreak initially hit the U.S., when the S&P 500 lost a third of its value, is just too much risk to bear for most people, and forces investors to sell at a market low and realize a huge loss.

Click image to enlarge
It's easy for someone to say, "Yeah, I can stomach the risk of a bear market." But then they learn the really hard way that they misjudged their ability to see their life savings slashed by 40%, and they sell at the worst possible time.
This kind of behavioral finance issue is where we professionals can make a huge difference in the lives of our clients.
Which is a good place to end this investment performance summary of what happened last quarter: by making clear that investment performance is only one part of managing your assets.
Issues like tax, financial planning, and tax-aware investing, as well as your personal risk preferences and money personality, are crucial to investment success.
If you're interested in determining how much risk is right for your retirement savings, let us know, and we will send you a link to a 10-minute online diagnostic that's fun and designed to reveal your risk tolerance and financial personality.
Click image to enlarge
INDEX OF QUARTERLY MARKET SUMMARY


© 2024 Integrated Financial Strategies
1042 N. Milford Road, Suite 102 | Milford, MI 48381
Phone: 248-932-9329 | Fax: 248-932-9345 | Email Us